
Containers
Galaxy containers are packaged environments that are optimized to run Meteor. Each container runs one copy of an app.
Usage
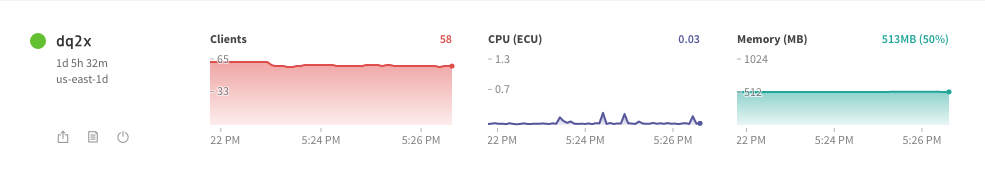
Each container has CPU and Memory allowance. Galaxy combines the pooled resources of all containers to track overall app performance. You can dive into individual container performance using the graphs on the app’s containers page.
Container sizes
Since every app has unique architecture and performance characteristics, adjusting the container size helps you meet the specific resource needs of your app.
- Compact: 512 MB/0.5 ECU
- Standard: 1 GB/1 ECU
- Double: 2 GB/2 ECU
- Quad: 4 GB/4 ECU
ECU is defined by Amazon and is designed to provide a relative measure of processing power. The abbreviation stands for EC2 Compute Unit.
The Galaxy CPU graphs show your CPU usage as a percentage of your container’s allocated CPU cap (or as a percentage of the total of all your containers’ CPU caps for the graph on your app’s overview page). Note that this is different from the CPU percentage shown in graphs in Meteor APM; APM does not known about container sizes and shows CPU as a percentage of a single underlying CPU core.
View logs from a specific container
Accessing the logs from a specific container can help you diagnose any unexpected behavior. Click on the icon near the container name to see the logs from this container.
Connect to a specific container
If you suspect a container is misbehaving or would like to access container-specific information, you may want to connect to that specific container to learn more. From your app’s containers page, click on the icon near the container’s name to see your app as served by this container.
Since we re-route to a new container when your container is unavailable, you should verify which container subscriptions and remote method calls are being routed through.
You can inspect the X-Galaxy-Container response header for the websocket resource using Chrome DevTools or the equivalent in your browser.
Kill a container
In instances when application code behaves unexpectedly you may want to kill a container. This forcefully stops the running process and launches your Meteor app in a fresh container.
You can kill a container by going to the designated container on your app’s containers page and clicking the kill button below the title.
Container restarts
Containers may be restarted for several reasons, such as:
- A bug in an app caused memory to spike, which caused its container to be killed and then restarted.
- The app was working correctly, but it was overwhelmed by the number of connections or the load placed on it. Consequently, its container ran out of memory, was killed and restarted.
- Your app exited.
- An unavoidable hardware or network problem spontaneously caused the underlying machine to break. (This is rare but impossible to avoid 100% of the time.)
- Galaxy had a need to replace the underlying machine on which your container is runnning (for security upgrades or to maintain cluster size).
If constant uptime is a core requirement, we recommend running your app on more than 1 container. This will protect your uptime against your app crashing or spontaneous hardware/network failures. When an app runs on multiple containers, traffic can be routed elsewhere when a single container fails or becomes unresponsive. (Automated machine replacements generally do not cause downtime, as we will start a new instance of your container on a new machine and wait for it to become healthy before stopping your existing container.)
Please note that, if you do choose to run a 1 container app, downtime will be unavoidable in the event of a container crash or a machine failure. Single container apps are not appropriate for apps with strong uptime requirements.