
Widgets for Dashboard
Dashboard Summary
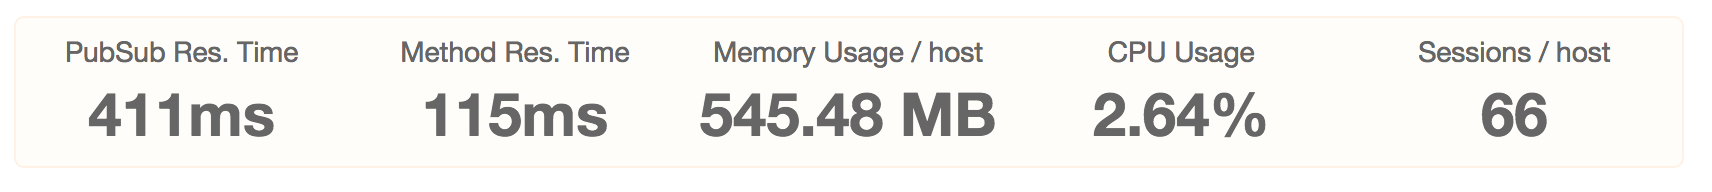
Dashboard Summary is a set of important performance metrics for your application. These are the metrics:
- Pub/Sub Res. Time - Average time taken to process your publications in the server
- Method Res. Time - Average time taken to process your methods in the server
- Memory Usage/Host - Average memory usage of all of your hosts. We calculate the RSS size.
- CPU Usage - Average CPU usage across all of your hosts.
- Sessions/Host -Shows the average number of sessions for a host
Average Pub Sub Response Time
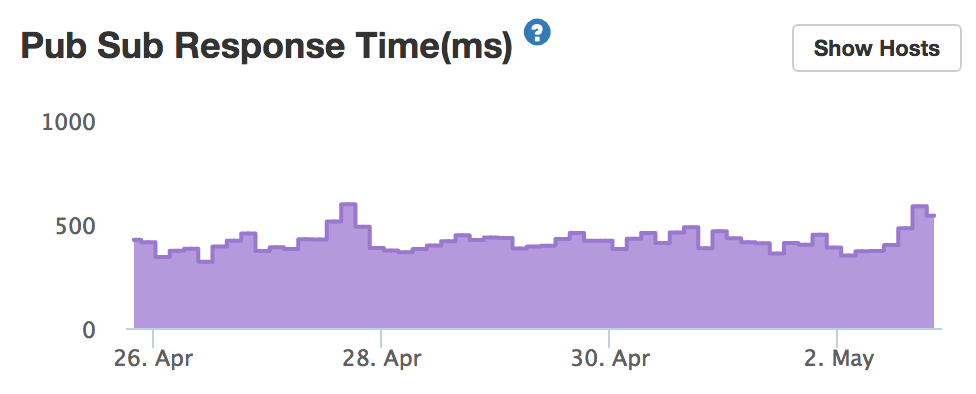
This chart shows the average response time for sending the initial data set for subscriptions. We calculate this metric when we detect this.ready() for a publication. This chart shows you whether your subscriptions are slow to process initially.
Average Methods Response Time
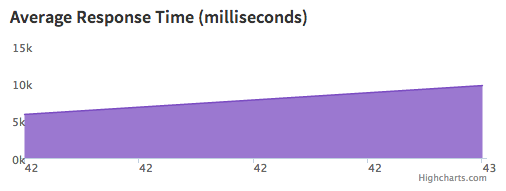
The chart above shows response time for method calls for the selected date range. The X-axis contains the date and the Y-axis contains the response time in milliseconds.
Memory Usage/Host (MB)
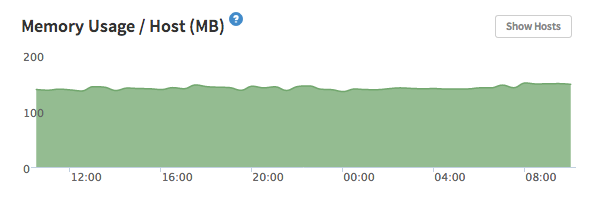
This charts shows the average memory usage across all the hosts in the given time range. We use RSS as the memory usage.
Event Loop Utilization
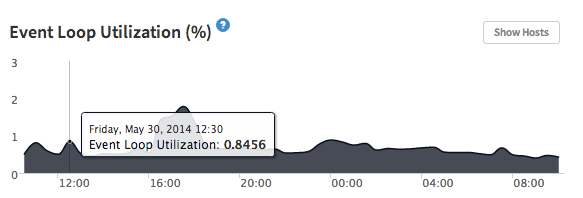
This charts shows the average utilization of the Event Loop across all hosts in the given time range.
CPU Usage
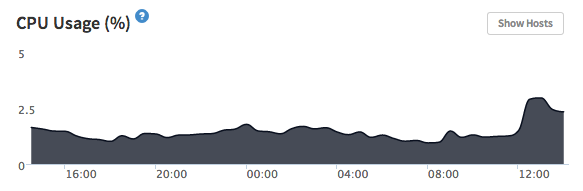
This charts shows the CPU usage in percentage of your app. We are using usage npm module to track the correct cpu usage used by your app.
On linux usage module tracks CPU time via /proc filesystem.
Total sessions
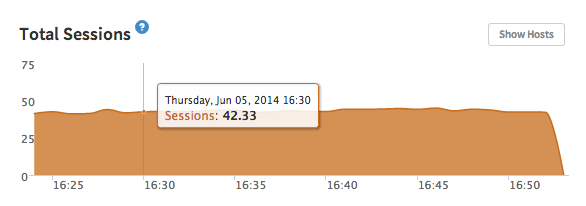
This chart shows the total number of sessions in the given time range.
Active Subscription

This chart shows the average number of subscriptions for a host across all hosts in the given time range.
Created Observers
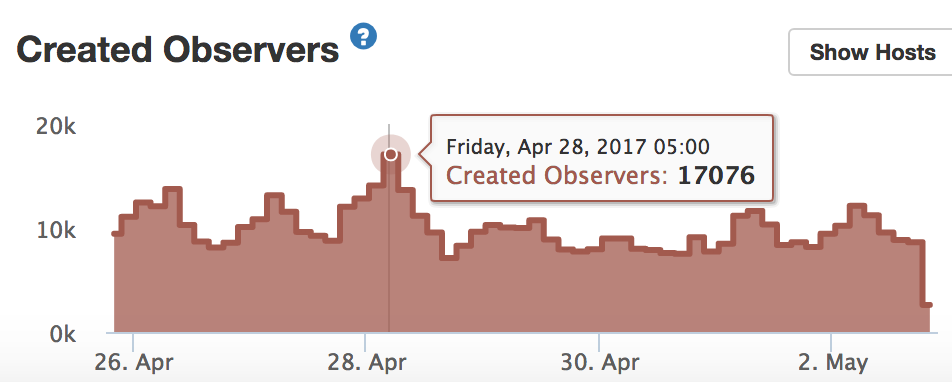
This chart shows total number of created Observers initiated in the given time range.
Background Information
Even though there are 1000 observers, actual number of observers will be less than 1000 because of observer reuse. If there are identical cursors, Meteor can reuse existing observers.
Created observers reflects the actual number of observers initiated.